

Last month, we reintroduced the Atlanta Schools Data Project (ASDP) – a community-centered tool designed to help families and community leaders better understand school performance across Metro Atlanta. Over the coming months, we’ll highlight different features of the tool and show how it can help communities explore school data in a clearer and more meaningful way. This month, we’re taking a closer look at Equity.
This month, the Governor’s Office of Student Achievement (GOSA) released 2025 Georgia Milestones results by student subgroups, allowing families and communities to see how different groups of students are performing. These results show outcomes for groups such as:
- Black students;
- Hispanic students;
- English language learners;
- Students with disabilities; and
- Students from low-income households
While overall school averages can be helpful, they can sometimes hide important differences in how students are performing. Looking at results by student subgroups helps show whether schools are supporting all students effectively.
Tableau data visualizations like the ones below are used to demonstrate how schools are performing across the Metro area in a given subject and subgroup. Our ASDP tool goes further by giving users a comprehensive picture of how their individual school is performing (see the next section for an explanation of how to use the equity feature).
For example, in this Tableau view, parents can find a comparison across Metro Atlanta schools of Black students scoring proficient and above in Math.
Parents can also filter results to create fairer comparisons, such as filtering by certification rate to compare test scores across schools with similar poverty levels.
Embed [https://public.tableau.com/shared/9472GW65S?:display_count=n&:origin=viz_share_link]
However, the data can be overwhelming and difficult to understand, and it doesn’t demonstrate overall equity in the schools. In the ASDP, the subgroup data is compiled and analyzed in the Equity feature, which allows users to explore how different groups of students are performing within a single school.
Using the Atlanta Schools Data Project
What the Equity Score Represents – and How to Explore It
ASDP combines subgroup achievement and growth results to create an overall Equity score, which reflects how well different groups of students are performing relative to schools across Georgia. This approach helps communities understand not just how a school performs overall, but also how well it supports students from different backgrounds.
The best way to understand this measure is to explore it directly in the tool.
Within the Atlanta Schools Data Project, you can:
- Search for a school
- Click into the Equity section
- Compare subgroup achievement and growth across student groups
By looking at these measures together, families and community members can better understand how schools are serving all students – not just overall averages.
Step #1: Start on a School’s Overview Page
To explore equity in ASDP, first select a district and school. This will take you to the school Overview page, which shows several different measures of school performance.
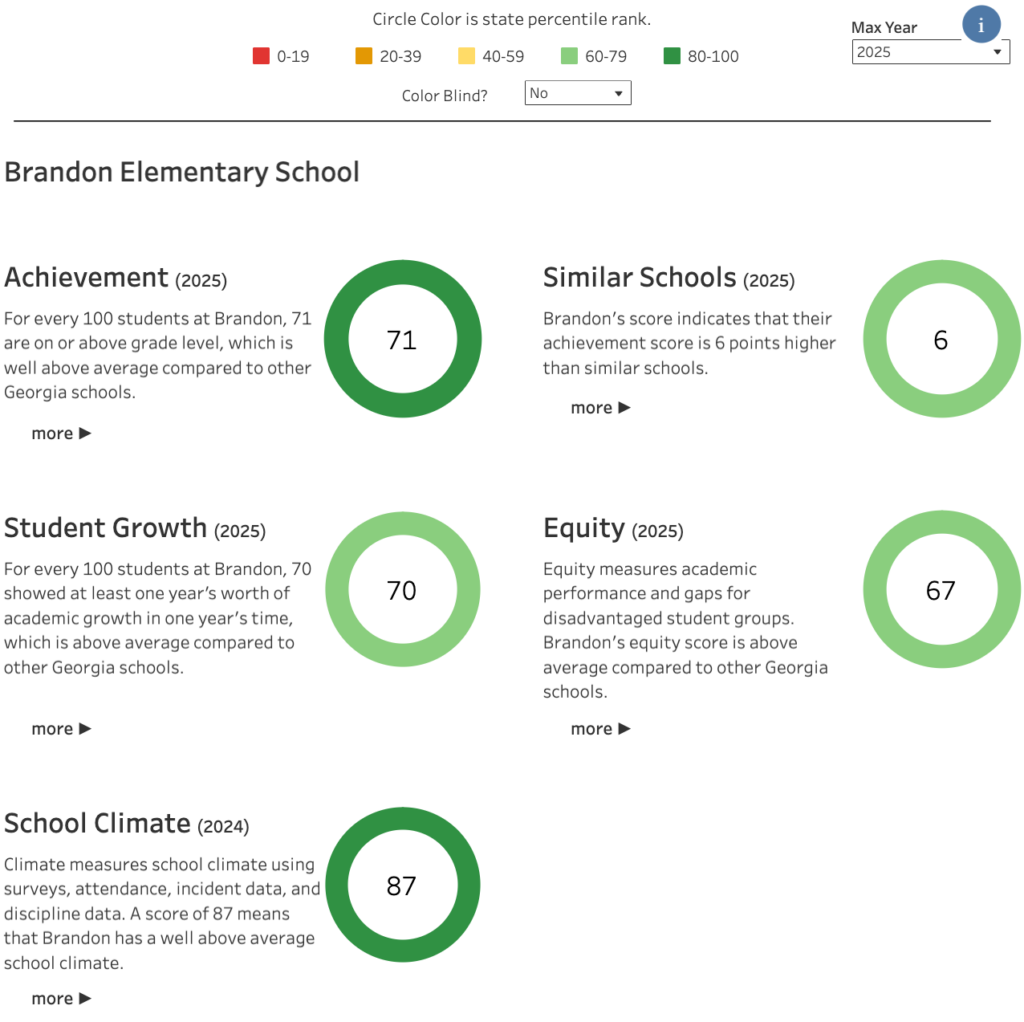
On the Overview page, you can see metrics such as:
- Achievement
- Student Growth
- School Climate
- Similar Schools
- Equity
The Equity score reflects how well disadvantaged student groups are performing relative to schools across Georgia. To see more details, click “More” under the Equity section.
Step #2: Explore the Equity Breakdown
Clicking into the Equity section opens a detailed page showing three components of equity.
This page includes:
- Achievement – the share of students scoring proficient or above on state tests across subgroups.
- Growth – how much progress students in these subgroups are making compared to academically similar students across Georgia.
- Gaps – differences in achievement between student groups within the same school.
Together, these measures help provide a clearer picture of how well a school supports different student groups. Looking at achievement, growth, and gaps together can reveal patterns that might otherwise go unnoticed. A school may show strong growth even if achievement levels are still developing, while others may demonstrate strong outcomes across multiple student groups.
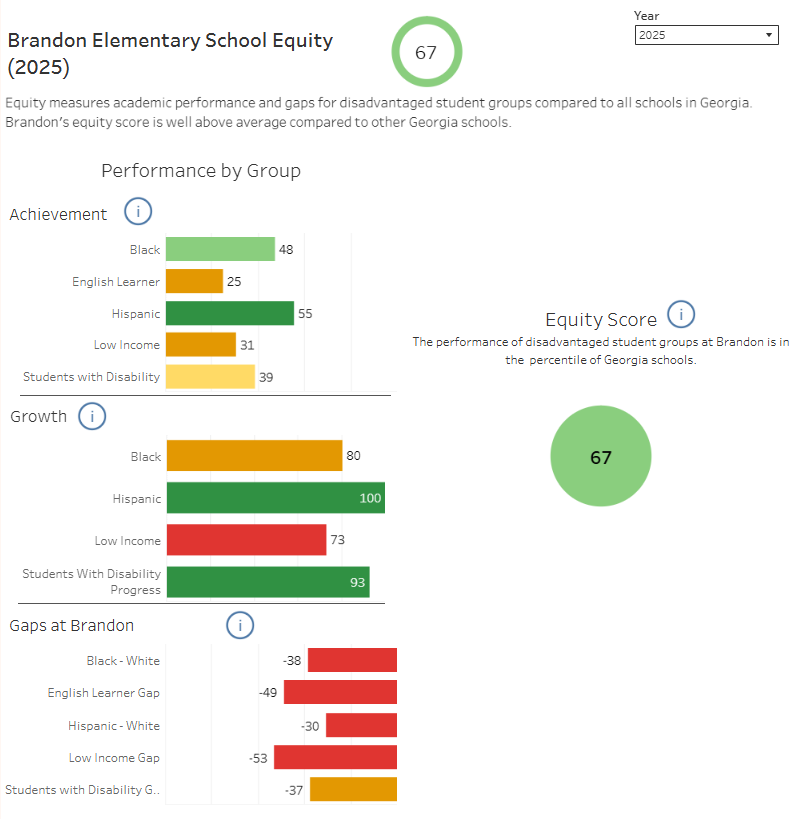
In the example shown here, Brandon Elementary received an overall equity score of 67 by factoring in its Achievement and Growth scores. On the interactive tool, a user can mouse over the data to see that the overall subgroup achievement score is in the 83rd percentile, and the overall growth score is in the 52nd percentile. The lower of these two scores is then compared against all other schools, and the result is the 67th percentile.
Why It Matters
Students take assessments like the Georgia Milestones so that parents, teachers, and school leaders have meaningful data to support student growth and achievement. But when results are released, the data can be difficult for many families and community members to interpret.
Tools like the ASDP help make this information more accessible. By translating complex data into clearer, easier-to-understand insights, the platform helps communities better understand how students and schools are performing and where additional support may be needed. Making data easier to explore is especially important for advancing equity and ensuring that historically underserved communities have the information they need to advocate for strong schools.
Stay tuned as we highlight more features of the ASDP and how the tool helps communities explore school data in clearer, more meaningful ways.