

Over the past several months, we’ve highlighted different features within the Atlanta Schools Data Project (ASDP) and how they help families and communities better understand school performance across Metro Atlanta. This month, we’re taking a closer look at school climate and what the data can tell us about the conditions within a school.
Understanding School Climate
School climate captures aspects of school life that academic results alone do not. This can include how consistently students attend, how safe the school environment is, how schools respond to student behavior, and how students, families, and staff experience the school. To bring these different measures together, the Georgia Department of Education uses a 1- to 5-star School Climate Star Rating built around four areas:
- Attendance is the percentage of students who miss less than 10% of days.
- Safe & Substance-Free measures reported incidents involving violence, bullying or harassment, and drugs relative to the school environment.
- Discipline reflects the use of consequences such as in-school and out-of-school suspension, assignment to an alternative school, and expulsion.
- Survey combines climate survey results from students, families, and personnel (teachers and staff).
Each domain is converted to its own star rating, and those ratings are averaged to produce the school’s initial Climate Star Rating. Looking across these four areas provides a more robust picture of school climate than any single measure could on its own. For a more detailed description, see the Georgia Department of Education’s School Climate Star Rating Calculation Guide.
Exploring School Climate Across Metro Atlanta
The visualization below shows how climate measures compare across Metro Atlanta schools and how the different parts of school climate relate to one another. The default view focuses on attendance, discipline, violent incidents, and student and staff survey results because our analysis found these measures are most strongly related to the overall climate score. Family Survey results are also available through the measure menu, along with additional climate indicators.
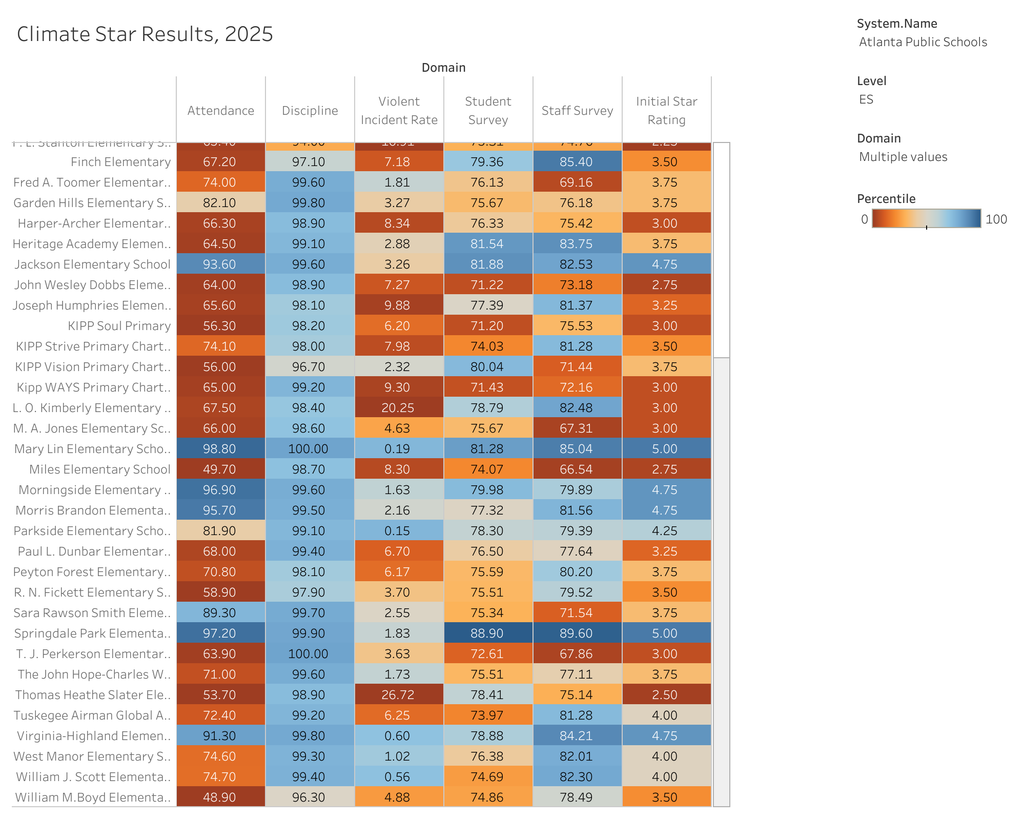
Climate Star Results 2025 Visualization
Visit the visualization to explore climate data across districts and view additional measures. Comparing the measures side by side makes it easier to spot where a school’s results are consistent and where they diverge. For example, a school may have strong attendance and discipline results while students or staff report a different experience through the climate surveys.
Understanding School Climate in ASDP
Within ASDP, the state’s initial 1- to 5-star Climate Star Rating is converted into a statewide percentile rank from 0 to 100, making it easier to see how a school compares with other Georgia schools serving the same grade levels. That percentile appears as the Climate score on a school’s Overview page, alongside measures such as Achievement, Student Growth, Similar Schools, and Equity. In the example below, Fountain Elementary School in Clayton County has a 2025 Climate score of 71, meaning its school climate is above average compared with other Georgia elementary schools.
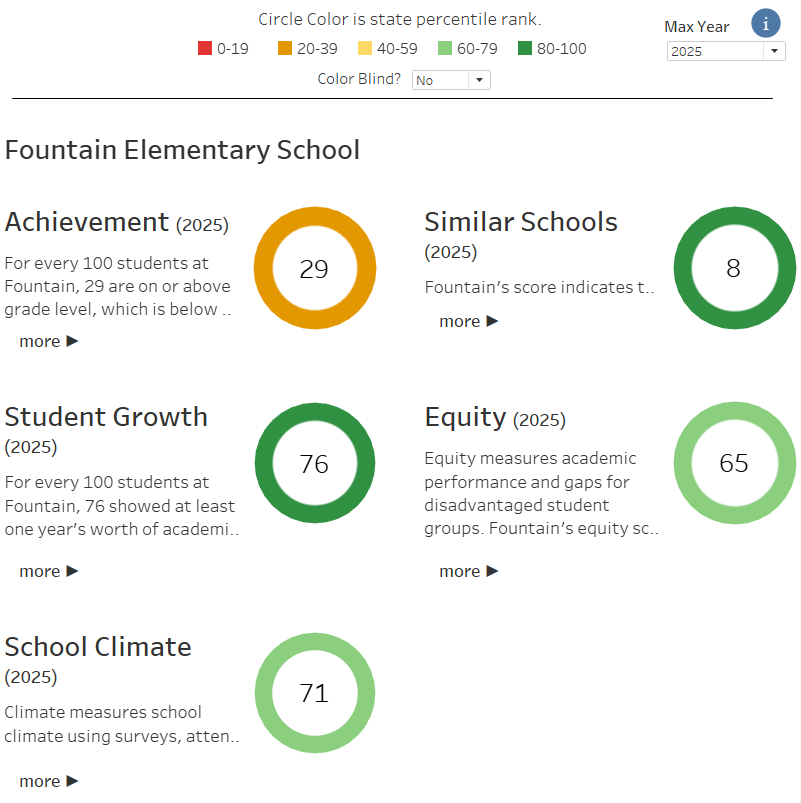
Clicking “More” under School Climate opens a more detailed view of the measures behind the overall score. See the measure menu on the right to customize the view.
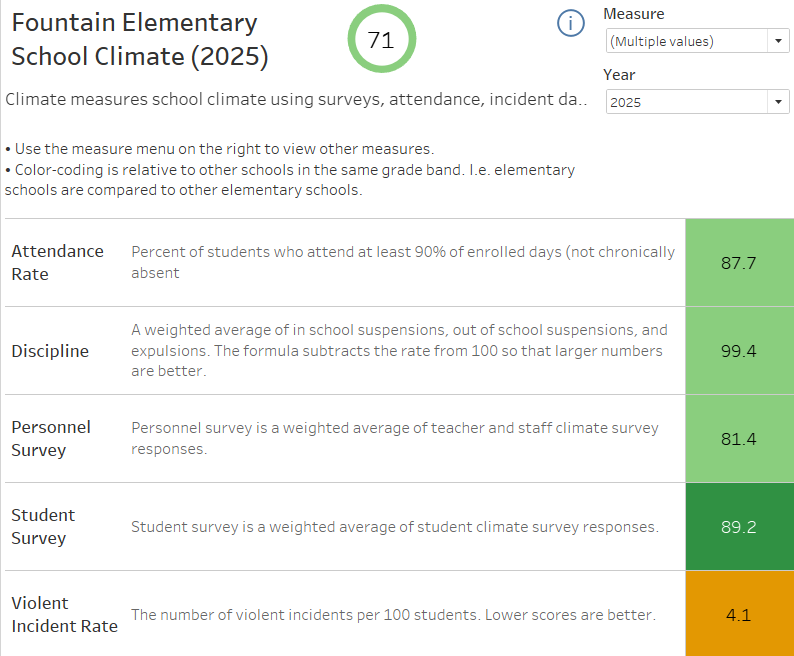
Relative to other Georgia elementary schools, Fountain Elementary School performs especially well on the student survey. Its student survey score of 89.2 places the school above the 80th percentile, while its attendance, discipline, and personnel survey results are all above the 60th percentile. The detailed view helps show what sits underneath Fountain Elementary School’s overall Climate score and where its strongest results are coming from. Visit the Atlanta Schools Data Project to explore school climate measures for individual schools across Metro Atlanta.