
Student populations across Metro Atlanta vary widely from school to school. In some, more than 90% of students directly certify for free lunch; in others, less than 5% qualify. There are schools with a mobility rate of over 50% and others where less than 5% of students change schools. Regionally and nationally, there is a strong correlation between the factors and student outcomes.
To help better understand student achievement in the context of a wide range of student populations, we created the Similar Schools score for the Atlanta Schools Data Project (ASDP).This score compares percent proficient on the Georgia Milestones exam in ELA and Math for schools across Georgia. The comparison considers percentages of students in the following categories:
- Direct certification for free lunch (a poverty measure)
- Mobility
- Students with disabilities
- English learners
- Race/ethnicity
Our analysis shows that poverty and student mobility are especially important in explaining differences in school performance. The other factors—students with disabilities, English learners, and race/ethnicity—also contribute to the statistical model and improve its accuracy. Visit the ASDP methodology page for more information.
The model used to create the Similar Schools score estimates a predicted Milestones percent proficient for each school using the factors listed above. To do this, we estimate a school’s expected proficiency rate based on its student population. We then compare that estimate to the school’s actual proficiency rate. The difference between the two is the Similar Schools score. Use this data visual to view predicted and actual proficiency rates for different school systems in Metro Atlanta.
For anyone who cares about students, schools, and the future of our region, this matters because it helps us look past the surface. It is easy to see test scores and jump to conclusions about a school, but those numbers do not paint a holistic picture. By putting results in context, the Similar Schools score helps us recognize schools with meaningful and intentional support systems for their students, helping them succeed even when the challenges are real. It also helps us notice where students may not be getting what they need, so we can respond with urgency and care. At its core, this is about making sure every child, no matter their circumstances, has a real chance to learn, grow, and thrive.
The Similar Schools Score on ASDP
The Atlanta School Data Project shows each school’s Similar Schools score on the front page and linked to a more detailed page. The example below looks at Resurgence Hall Charter School, which has one of the highest Similar Schools scores in Metro Atlanta.
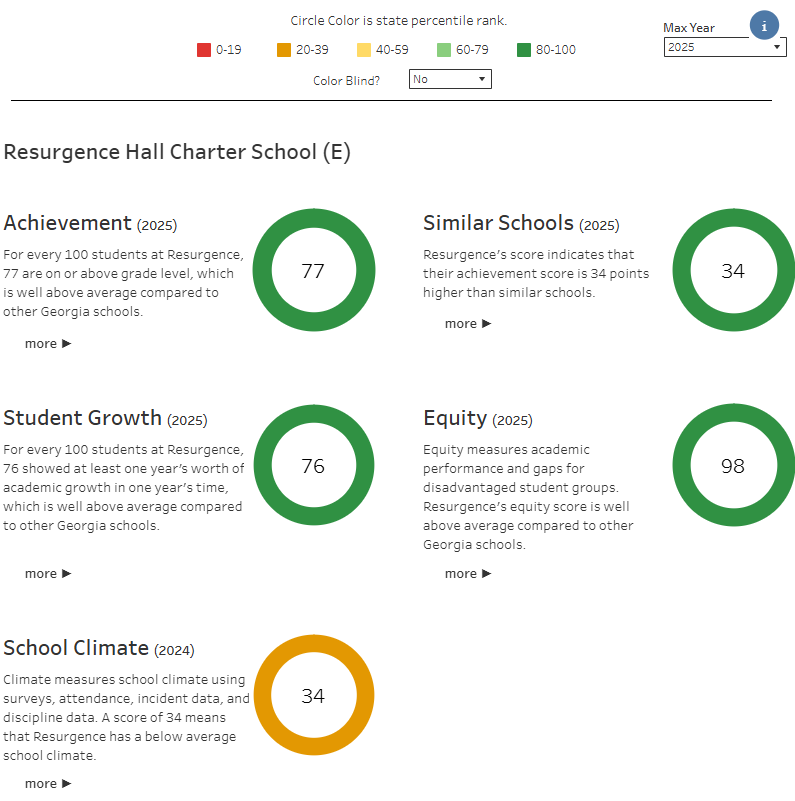
Resurgence Hall’s Similar Schools score of 34 means that their Milestones proficiency rate is 34 percentage points higher than other Georgia schools with similar student populations. The link for “more” under the score shows more details.
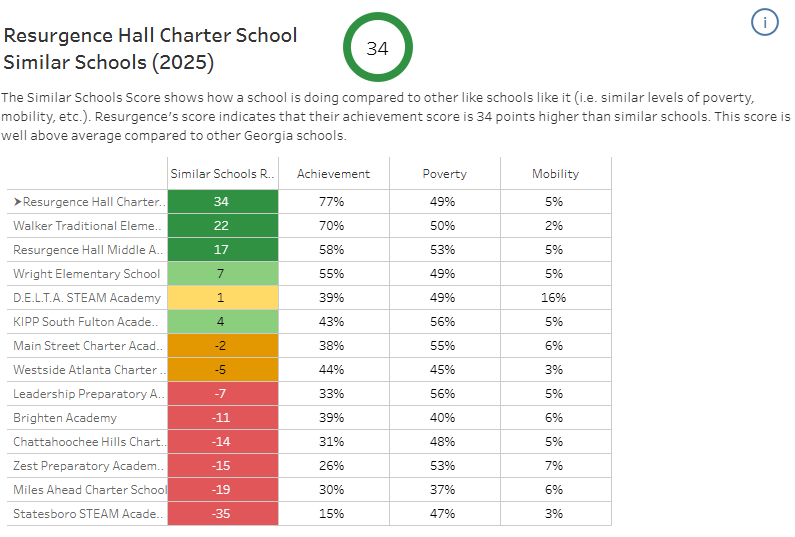
This view shows Resurgence Hall and other schools that have similar student populations. Note that Resurgence Hall has a poverty rate of 49% and a mobility rate of 5%. The other schools on the list have similar rates. Resurgence Hall’s achievement rate of 77% and Similar Schools score of 34 implies that a typical school with a similar student population would have a proficiency rate of about 43% (77 minus 34). We can see in the table that 43% is a more typical achievement score for schools that are similar to Resurgence Hall.
Metrics Like the Similar Schools Score
The Similar Schools score has some similarities to the Governor’s Office of Student Achievement’s Beating the Odds (BTO) score. Both use statistical models to compare schools with similar student populations.
The key difference is the outcome being measured. The BTO score is based on the CCRPI single score, which combines multiple components into one summary measure. The Similar Schools score instead focuses directly on Milestones proficiency rates.
This makes the Similar Schools score easier to understand. A higher score directly reflects stronger test performance relative to similar schools. In contrast, changes in the CCRPI score can be driven by multiple factors, some of which fluctuate from year to year.
As a result, the Similar Schools score offers a more stable and straightforward way for families to understand how a school is performing academically.