
Over the past few months, we’ve highlighted different features within the Atlanta Schools Data Project (ASDP) and how they help families and communities better understand school performance across Metro Atlanta. This month, we’re taking a closer look at Student Growth – an important measure that provides a perspective on how schools are supporting student learning over time.
Understanding Student Growth
When families look at school performance, one of the first things they often see is achievement data: the percentage of students scoring proficient or above on state assessments. While achievement matters, it only tells part of the story. It shows how students are performing at a specific point in time, but it doesn’t always show how much progress students are making year over year.
That’s where student growth becomes important. Student Growth Percentiles (SGP) measure how much academic progress students make from one year to the next compared to academically similar students across Georgia. While achievement tells us how students are doing today, growth helps families and communities understand whether students are continuing to move forward academically over time.
Exploring Growth Across Metro Atlanta
The table below highlights the percentage of students demonstrating typical or high growth by school and year across Metro Atlanta schools.
Users can filter the school-level visualization by district, subject area, grade cluster, and year to explore different patterns across schools. For example, looking across multiple years helps provide additional context for understanding school performance because some schools demonstrate consistently strong growth over time, while others fluctuate more from year to year.
Another table provides a broader system-level view of student growth across Metro Atlanta. Instead of comparing individual schools, this view shows the percentage of students demonstrating typical or high growth across entire school systems.
Together, this data helps families and community members explore growth from different perspectives. The school-level view shows what is happening within individual schools, while the system-level view helps identify broader regional patterns across districts. Both views can be filtered by subject area, grade cluster, and year. These Tableau visualizations help communities explore broader trends, while the ASDP tool helps families understand what growth looks like within an individual school.
Understanding Student Growth in ASDP
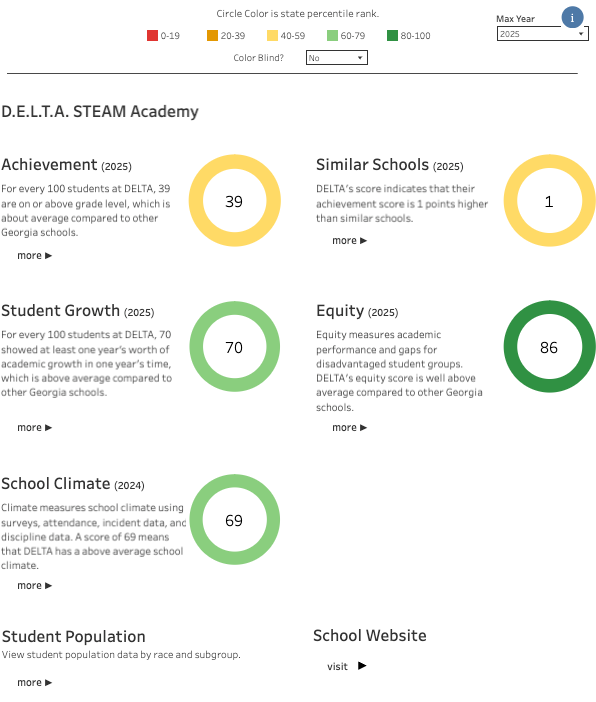
Within ASDP, families can explore student growth directly on a school’s overview page, alongside other measures such as Achievement, Similar Schools, Equity, and School Climate. In the example below, D.E.L.T.A. STEAM Academy received a Student Growth score of 70. This means that for every 100 students at D.E.L.T.A., 70 showed at least one year’s worth of academic growth in one year’s time, which is above average compared to other Georgia schools.
Clicking “More” under the Student Growth section opens a more detailed view of how students are progressing over time. On the detailed Student Growth page shown below, users can see that approximately 8 out of 10 students demonstrated at least one year’s worth of growth in English, while about 6 out of 10 demonstrated at least one year’s worth of growth in Math.
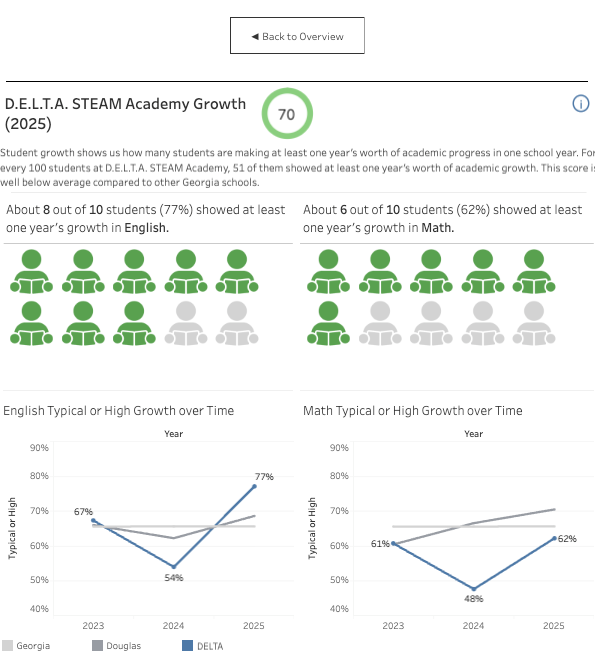
The charts below those summaries show how growth has changed over time compared to district and state averages. Looking at these trends together helps users understand how schools are supporting student learning across subjects and over multiple years.
Growth data can sometimes reveal strengths that achievement data alone may miss. A school may still be working to improve overall proficiency rates while also helping students make strong academic progress year after year. At the same time, schools with high achievement do not always demonstrate strong growth every year. Looking at both measures together creates a more complete understanding of school performance.
Why It Matters
Families deserve school information that is transparent, meaningful, and grounded in context. Too often, school performance conversations are reduced to a single score or rating that fails to fully capture what is happening within a school community. Student growth provides another way to understand school quality by focusing on how much progress students are making over time. By looking at both achievement and growth together, families and communities can better understand not only where students are performing today, but also how students can perform tomorrow.